
Finding Happiness in ‘The Smoke’
The Smoke, to use London’s nickname, has 32 boroughs plus the central business district known as the City of London. What does Cluster Analysis tell us about the characteristics that bind them?
Created in blogdown with the tidyverse at their
Written by Carl Goodwin
The Smoke, to use London’s nickname, has 32 boroughs plus the central business district known as the City of London. What does Cluster Analysis tell us about the characteristics that bind them?

Are the residential property bands of 3 decades ago becoming less so? Would a sample of those recently-sold reveal band convergence? And what may be inferred about those not sampled?

The Natural History Museum began recording cetacean strandings in 1913. For some records the species is uncertain. Could these be predicted using tidymodels and textrecipes?

Before the post-Brexit trade negotiations concluded, what did quantitative textual analysis and word embeddings tell us about the shifting trade-talk sentiment?

The Goldilocks principle has its origins in a story about a girl who tastes bowls of porridge left by three bears. When investing in stocks, how many might be ‘just right’?

Covid-19 began battering the financial markets in February. Which sectors are faring best when comparing each in the S&P 500 with the overall market since February 19th, 2020.
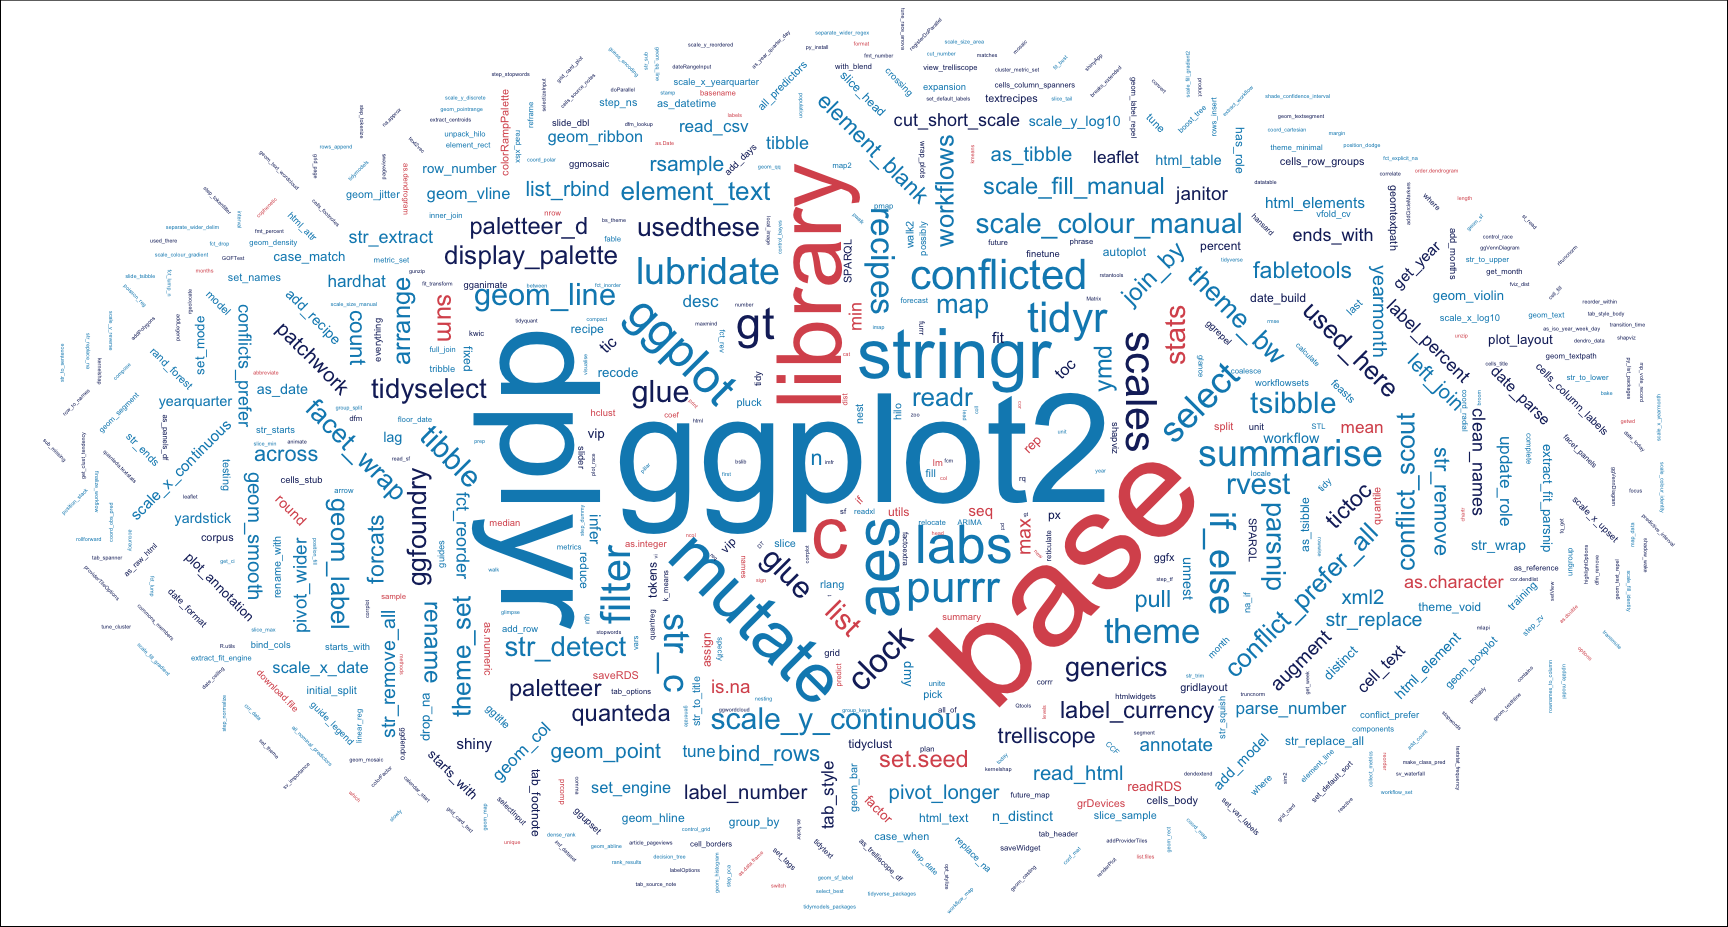
R packages & functions that make doing data science a joy. Established by aggregating actual usage across quantumjitter projects.
Animated dimensionality reduction and whether East and West are drifting closer or farther apart based on historical UN voting patterns.

There comes a point where the sheer volume of small multiples one wants to visualise requires a different strategy.

Humans have the magical ability to plan for future events. But it’s not quite a uniquely human trait as ravens can match a four-year-old.
Exploring colour palettes and small multiples with ggplot2.

Criminal goings-on in a random forest and predictions with other models from the Tidymodels framework.

Every story needs a good plot. Which plot types generate the most interest on Wikipedia?

Exploring parliamentary voting patterns with hierarchical clustering

Do we see more planning applications when house sales are depressed?

A little interactive geospatial mapping and an unexpected find

A series of events, such as the Financial Crisis and the 2016 Brexit vote, that damped down residential property sales in London
When visualising a small number of overlapping sets, Venn diagrams work well. But what if there are more. Here’s a tidy(verse) approach to the exploration of sets and their intersections.
Welcome to the tidyverse with data ingestion, cleaning and tidying. And some visualisations of sales data with a little jittering.